
In part I, I described my quest to beat a PR of 1:46 set in the previous year for the same half marathon. Unfortunately, as the race drew closer, there wasn’t enough time left to train normally.
Instead, I turned to the Fitdigits assessments to help streamline my training. I completed the Fitdigits CP30 Running Assessment to determine my maximum heart rate (maxHR)*, heart rate zones** and lactate threshold***. I knew if I could stay below my lactate threshold, I could definitely finish the race. If I went above my threshold, I might bonk, become too fatigued or worse, injure myself.
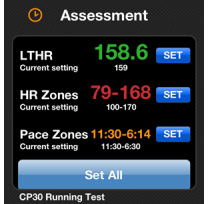
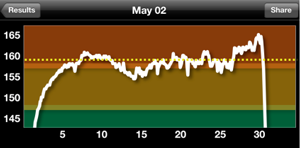
Taking the CP30 Running fitness assessment ten days before the half marathon was essential to my race strategy and ultimate success. The screen shot on the right is my CP30 results which calculated my lactate threshold (LTHR) of 159 beats per minute (BPM) which became my strategy for race day: keep my heart rate below 159 BPM during the race. View my 30 minute assessment heart chart.
I’m surprised how few of us really know how fit we are. If you accurately identify your fitness level, it becomes incredibly easy to tailor your fitness program. For example, working out too hard or too easy can have a profound affect on your performance and overall enjoyment of your activity. To illustrate my point, the following two graphs show how my heart zones differ between the standard 220 – age and my CP30 assessment.

Industry Standard: Fitdigits Industry standard 220-age (as used by Fitdigits and other heart rate monitors) calculated my maxHR at 163 beats BPM, Zone three at 113-129 BPM.
CP30 Assessment: Fitdigits CP30 Running Test determined my maxHR as 168 BPM with my lactate threshold at 159 BPM and Zone 3 at 142-149 BPM.
Notice the following:
- My maxHR measured 5 BPM higher in the assessment vs standard 220-age. My lactic threshold previously calculated at 122 BPM (85% of maxHR) and improved by 21 BPM in the assessment to 159 BPM. For some, differences can be as high as 20 BPM.
- My Zone 3 significantly changed. As it turns out, my Zone 3 (necessary for race day training) was off by 10 BPM using the industry standard. Standard 220-age calculated my Zone 3 at 113-129 BPM but I should have been training at 142-149 BPM thanks to the CP30 calculations. In fact, 113-129 is actually more like my zone 1 than Zone 3. Big difference.
So what does all this mean? Thanks to the CP30 Running Assessment, I was able to complete my half marathon injury free and very close to my target pace. Knowing my true maxHR, lactic threshold and proper zones made it possible for me to complete the race with minimal training.
I don’t recommend taking the assessment as a replacement for training but given that I’m relatively fit and healthy, it made all the difference. So, if you are training for a race, trying to lose weight or just exercising to stay in shape, take a Fitdigits Assessment to determine your actual maxHR, lactate threshold and proper zones. Exercising with accuracy affects your training, performance and general well-being.
Race Day
We arrived at the Santa Ynez marathon starting point at 6:30AM; 30 minutes before the start. The morning was cool, low 50s, and shrouded in a light fog. Just about ideal race conditions.
The racecourse weaves its way through scenic rolling hills, colored in peaceful green headed to light golden brown and spotted with oaks, cattle and horses. The area is building its appellation reputation due to the growing number of small up-and-coming boutique wineries — hence the name Wine Country Half Marathon.
About 3,000 entrants are milling around, hugging themselves and rubbing their arms up and down, slightly jogging in place, just keeping moving to stay warm. As common to many half marathons, about 70% of the runners are women.
With 5 minutes before the start, Sven and I worked our way forward through the crowd, estimating where the 7:30 – 8:30 pace groups were congregating. I started reminding myself to, “Stick with your race strategy. Watch your heart rate, not the clock, and not your pace. Don’t get swept up in a fast start. And don’t try to stay with Sven.”
The gun sounded, the crowd slowly shuffled through the starting gate, the pace gradually quickened. I found myself dancing more than running as I avoided the hundreds of falling feet each establishing their footing and pace.
While I had started next to Sven, with less than 5 minutes into the run it was getting hard to spot him in amongst the racers headed off the front. I glanced down at my phone and sure enough, my heart rate had spiked, driven by the adrenalin of race start and chaos of the first half mile. “Okay Dean, settle down, run your race.”
The 13.1 course is split 60/40 as uphill and down hill. The first leg is a gentle 200 ft uphill grade which ends in a short, steep 150 ft climb. The second half mirrors the first but descends 450ft to end with a 100 foot climb about a qtr mile from the finish.
I like running uphill. And I’ll admit, I like passing runners on uphill climbs. It’s a macho thing which as I age, I’m wisely letting go. The year before I kept a strong pace up the steep grade. But upon cresting I realized that I had spent a lot and didn’t have much kick going down the back side. I remembered that mistake and promised myself I wouldn’t make it again.
The race was moving along well. I kept my Fitdigits screen on the heart chart and kept my heart in a +/- 3 heart beats around 156. I was feeling good and strong as I approached the steep climb. As I started up the grade, I watched my hr climb so I slowed down my pace, holding back the horses that wanted to charge upwards.

Just prior to the crest I was smiling as I had stayed my course … but I was feeling a bit too good. I decided to up my speed down the back side passing a few dozen runners. My heart rate rose to 164 while I wasn’t watching and I found myself breathing hard and noticeably tiring. I looked at my chart, saw my errant ways and slowed it down. But by then my legs were heavy. I’d spent too much time in zone 5 and the lactic acid had taken its toll. Even though I was now running a gentle down hill, my pace was noticeably slower and I was working to keep my heart rate at 152. It took me almost 30 minutes to recover in preparation to crank it up for the last 2 miles.
 At mile eleven I picked up my pace. I was feeling tired but still had the will and power to press on. When I hit the last short climb, I slowed it down, watching my hr, and made my way up. At the top I started pushing again with just a mile to the finish line. The end of the course takes a sharp left turn into the middle of the town. The turn is about an 1/8th of a mile to the finish. With the turn in sight I let the horses run finishing with a sub 6:00 pace.
I passed through the banners, hit slide to pause and end workout button, finishing with a 1:50:51 Fitdigits time. Just 4 minutes shy of my personal best. I was feeling great and a little smug. For the most part, I kept to my plan, cutting myself some slack for my downhill splurge.
Sven was there to greet me with his big broad smile. He had crossed the finish line 10 minutes earlier.

*maximum heart rate (maxHR) is the highest number of times your heart can contract in one minute. Max HR is the most useful tool to be used in determining training intensities, because it can be individually measured or predicted.
**heart rate zones are a range of heart beats. Recent research has shown powerful benefits from exercising in several different zones to get maximum benefit.
***lactate threshold or lactate inflection point is when your body starts producing more lactic acid than the blood can remove from your muscles which accelerates fatigue and can lead to injury. Read more )